
A few years ago, some American and international cartography and GIS experts banded together to hold low-key community mapping events under the Maptime label. The international site and the MaptimeTO Twitter account of the Toronto group are dormant, but the idea is alive and well – let’s start a Ryerson University map club under the MaptimeRU banner!
In class the other day, we had a look at “The True Size Of…” web app, which illustrates the size distortion of countries under the Web Mercator projection. Some students already knew the example of Greenland. In most online maps, Greenland looks about as big as the continent of Africa, but its size is greatly inflated under the Mercator projection due to its far-northern latitude. When you pull it towards the equator for size comparison, it shrinks to as little as 7% of Africa, and that is the actual ratio of their land surfaces.

Size comparison maps are popular talking points but they are surprisingly tricky to make in geographic information systems (GIS). After all, we usually aim to map things at their actual location on planet earth’s surface. John Nelson, cartography and user experience specialist at world-leading GIS company Esri, recently posted a blog and video tutorial on “How to make one of those size comparison maps” in ArcGIS Pro. As possible kickoff for a recurring MaptimeRU meetup, I will sit down with interested Geographic Analysis students during study week and replicate John’s instructions as well as try the same in the free and open-source QGIS package.
Part 1 – A Size Comparison Map in ArcGIS Pro
Ryerson students who do not have ArcGIS Pro access, visit the Geospatial Map & Data Centre and follow their instructions. In ArcGIS Pro, we need a “layout” that pulls in two different maps, one for each of the areas being compared. Another one of John Nelson’s tutorials, the video “One Minute Map Hack: Create a Reverse Area of Interest“, comes in handy. Using layers from Esri’s Living Atlas, create the first map for the larger of your areas as a “reverse area of interest” as follows:
- Add “World_Imagery”, “GlobalBackground”, and “Canada_Provincial_boundaries_generalized” to the ArcGIS Pro project (instead of Canada, use world countries or another boundary layer depending on which jurisdiction you want to compare to).
- In the properties of the Canada layer, create a “definition query” for the Province of Ontario (or do this for your selected country/countries in the world layer); this will reduce the display to the selected jurisdiction.
- Use Analysis | Tools to open the Geoprocessing tab and search for the “Erase” function. Fill the dialog to with GlobalBackground as the input features and Canada (World or whatever) as the erase feature(s). This creates a layer that has your jurisdiction of interest cut out of the background, thus you will now use the background layer as a mask on top of the world imagery basemap. And you can make the background colour somewhat transparent for effect.

For the second map (click Insert | New Map), complete some of the above steps for the other area you want to compare. I did this for Germany using the World_Countries_(Generalized) layer form the Living Atlas, with a definition query to show only Germany, and a cartographic symbol that shows the outline of the country with a semi-transparent fill colour. Obviously, skip the basemap here since we need this second map to work as a partially transparent overlay.

Another step is required for both maps: they need to be set to the same projection, irrespective of what that projection is. Following John Nelson’s example, I set both maps (individually) to “The World from Space” via their properties dialogs. To center the projection on each of the two areas of interest, right-click on the projection’s name, choose “Copy and Modify…”, and edit the “Longitude of Center” and “Latitude of Center” to some x/y coordinates near the centre of each area.

To put the two maps together, open a blank layout (Insert | New Layout), create two identically sized maps (Insert | Map Frame) to add the two areas on top of each other. One of the core “tricks” occurs at this point: you need to set the two maps to the same scale, too. Just activate one of the map frames in the Contents pane and copy the scale number at the bottom left of the map window. Then Close Activation, activate the other map frame and paste that scale number into its scale selector. You can also move the map feature in the top frame while it is activated. For example, I moved my little Germany into Northern Ontario for aesthetic purposes. And this concludes the main part of this post!
Part 2 – Size Comparison Using Features-to-Graphics Conversion in ArcMap
In our undergrad program in Geographic Analysis, we emphasize the value of software-independent GIS knowledge. Therefore, I like to use different GIS packages within my courses and sometimes try to replicate a process completed in one package using one tool with a different workflow in another packages and/or using another tool. In preparing for the MaptimeRU session, it occurred to me that converting geographic features to graphics, and manipulating the latter would also do the trick. To my surprise, I had to realize that ArcGIS Pro does not offer the convert-features-into-graphics function that I know from its predecessor software, ArcMap. So here is a quick example of an alternative approach to size comparison maps using ArcMap.

For this project, we use free data from Natural Earth for 1:50 million “cultural vectors” for administrative level 0 (countries) boundaries. Add this layer to a new ArcMap project, select some countries of interest (nine European countries in my example), export the data for the selected boundaries, and add the resulting new layer back to the map (black outlines in the left half of the map canvas shown above). Importantly, set the data frame properties to a projection (coordinate system) that is suitable for comparing your selected countries; I used Europe Albers Equal-Area Conic. Then right-click, Convert Features to Graphics, and select “Draw the converted graphics and the features”. These will initially overlap but when you turn the layer off, you will be surprised to see its copy in the form of graphics objects. These can be selected and moved around the map individually (using the black arrow tool to “Select Elements”), their properties such as outline colour be changed, and via the Edit menu you can also select all graphics at once, e.g. to move them as a group or to delete them.

To be honest, the colour-on-black look from the File | Export Map function was a happy accident due to the background colour setting from a previous use of ArcMap. It looked pretty neat after I gave Poland the white outline colour you see above. One of the best examples of this style of size comparison “maps” is the Neptis Foundation’s “Metropolitan Indicators Poster” from 2007, which compares the extent of major urban areas around the globe in connection with their population densities and transportation networks. Once your geographic features are converted to graphic elements, you can also grow or shrink them and even rotate them, so perhaps you might try to recreate “This Upside-Down Canada Map [that] Looks Like a Tropical Paradise“?
Part 3 – Comparing Projections in QGIS
For Part 3 of this post, let’s have a look at size comparison mapping in QGIS. Or, perhaps even better, let’s compare an area with itself, with respect to its size and shape distortions under different projections! If you are new to projections, you’ve got to watch the absolutely fabulous Vox video on “Why all world maps are wrong“. For the connoisseur, check out “What your favorite map projection says about you“.
Unlike Esri’s platform, QGIS does not come with access to cloud-based data sets, so we’ll visit the Ontario GeoHub to find open data for the provincial boundaries. It’s actually quite difficult to find the boundary among all the other, much richer available data sets. The direct link is https://geohub.lio.gov.on.ca/datasets/province/data. After downloading and unzipping, the Shapefile with the Ontario boundary can be added to QGIS as a vector layer. It comes up unprojected with geographic coordinates in decimal degrees shown in the coordinate display at the bottom of the map. We will compare its appearance with the Web Mercator and the Ontario Ministry of Natural Resources’ Lambert projections.

Using the layer’s right-click menu, duplicate the layer twice for a total of three copies, of which we’ll keep only one visible at any time in QGIS’s main window. Start with the copy that you want shown in geographic coordinates, ensure that no on-the-fly projection is set in the project properties, and click the Zoom Full button to set and center the map extent. Select Project | New Print Layout…, give the layout a title, and use Add Item | Add Map to create a full-page canvas for the currently active layer. With the map canvas selected, open the Item Properties and check both Lock Layers and Lock Styles for Layers. Then go back to QGIS’s main window, display the next copy of the Ontario boundaries, open project properties (not layer properties), set the projection to Web Mercator (use search), click Zoom Full without changing the window size. Go back to the layout window, add another full-page map canvas, in which the second layer copy will appear, and lock its layers and styles. Also uncheck its background property to make it transparent in order to see the underlying first copy. Do this one more time for the third copy of the layer, if you wish to compare with another projection such as MNR Lambert for Ontario. Also note that QGIS version 3 has a new feature that allows you to “split” your project layers into “map themes”, which you can then view separately, as shown above, and use within the print layout instead of the lock-layers trick.

At this point, your layout should start looking like my work above. In contrast to the size comparison discussed at the beginning of the post, in this second part the map scales will not be comparable, since the scales of different projections are accurate only in some areas of the globe. What I therefore did is to select the map canvases in the layout’s item list and individually adjust their Position and Size property to arrange the layer copies for easy comparison. In other words, the sizes of the projected boundaries are not directly comparable, although trends are. For example, the geographic coordinate system (also known as equirectangular projection or lat/lon projection) tends to shrink the northern latitudes, while the Web Mercator projection inflates the distance between northern longitudes. The Lambert projection better reflects the convergence of the meridians as seen in the parts of the western and eastern provincial borders that point straight north in reality and are mapped with a slant towards the distant pole.
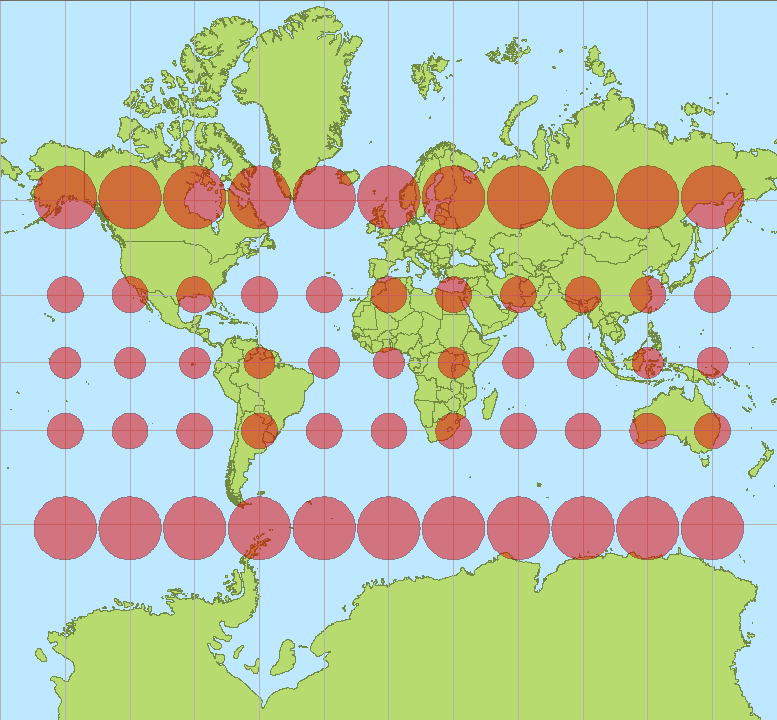

Source: Stefan Kühn, CC BY-SA 3.0, via Wikimedia Commons
A great tool to assess the size and shape distortions of a projection is Tissot’s indicatrix. The Wikipedia page explains the tool in as much or little mathematical detail as you wish, and the corresponding Wikimedia gallery has examples of a number of global projections, including Mercator and World-from-Space, which we are beginning to get familiar with! For further reading about Mercator and its alternatives, specifically for Canada, I recommend “Mercator, it’s not hip to be square” by Kenneth Field, another cartography specialist and blogger with Esri Inc. I also discussed projection as one element in “How to Lie with COVID-19 Maps“.